


Deposits360°® Monthly Industry Review
- Andrew Mitchell

- Jul 29, 2025
- 4 min read
Updated: Sep 2, 2025

This month’s Review highlights emerging deposit trends and signals in Deposits360° Cross-Institution Analytics database and deposit pricing/volume models.
CD Growth Vanishes, NMDs Hold
The third quarter of 2025 has begun, and the Fed continues to exercise a wait-and-see approach when it comes to adjusting its policy rate. This extended pause (seven months and counting) has resulted in a deceleration of deposit cost reductions and a partial unwinding of the growth trends from the Fed tightening cycle of 2022/23. Since last October, Non-Maturity Deposits have once again become the catalyst for total portfolio growth, while CD growth has been much harder to attain.

Source: Darling Consulting Group Deposits360°®
There is a convergence of factors causing this overall shift in depositor preference for NMDs. Institutions have lowered CD offering rates in the wake of last year’s Fed rate reductions. Additionally, given economic uncertainty with respect to tariffs, inflation, and the future path of interest rates, depositors have become more reluctant to lock up their funds for extended periods, preferring more liquid accounts even if it means giving up 50 or 100 basis points.
Banks and Credit Unions are adjusting to this shift by being slower/more cautious on lowering existing premium account rates to retain deposits and elevate growth, essentially lagging the market. Some institutions are even rolling out new premium-rate Savings/MMDA accounts to capture maturing CD balances while attracting new funds at below-wholesale rates.
DCG’s deposit volume models project overall deposit growth to continue over the next 12 months. If the Fed continues to hold its policy rate at the current level, we forecast 4% growth, with NMDs expected to grow 6% while CD portfolios decline by 3%. If rates begin to fall, we anticipate an additional benefit to the deposit growth outlook. In a ramp down 100bp scenario, DCG models project an additional 2% of deposit growth relative to the base.

Source: Darling Consulting Group Deposits360°®
The institutions successfully growing their CD portfolios are often doing so by being ultra-competitive with rate. Some have a strategic initiative to gain market share and bring in new relationships even if the short-term cost might be comparable to or above wholesale rates. However, most are managing CD pricing to lower overall costs while retaining maturing balances. The following chart shows that rollover rates have been trending higher, suggesting that institutions are seeing success on the retention front.

Source: Darling Consulting Group Deposits360°®
Overall, net CD outflow has not turned into a loss-of-liquidity problem for most institutions, as most CD maturities are either rolling into new CDs or moving into NMDs. The challenge has been attracting new CD balances at a reasonable cost.
Deposit Pricing Holds Firm
The pricing landscape was moving steadily lower in the first part of the year, and now rates have stabilized. However, there are a couple of notable trends. First, an uptick is beginning in Savings and Money Market accounts, particularly as institutions manage their premium rate offerings and rate-sensitive depositors shift into more competitively priced products (see MMDA Rate Trends chart below). Additionally, while overall CD costs are down by 2bp over the last month, the most competitive offerings (90th percentile) remain tethered to the 4% handle, a level that has become a psychological floor for rate-sensitive CD depositors looking to maximize income.

Source: Darling Consulting Group Deposits360°®
While the MMDA rates above reflect total weighted average portfolio rates, the following chart highlights newly opened MMDA rates. The rates on new accounts are beginning to trend slightly higher, most notably among those institutions that are in the bottom 10% of industry offering rates. This is another indicator that institutions are addressing depositor demand for yield on savings accounts in the current environment.
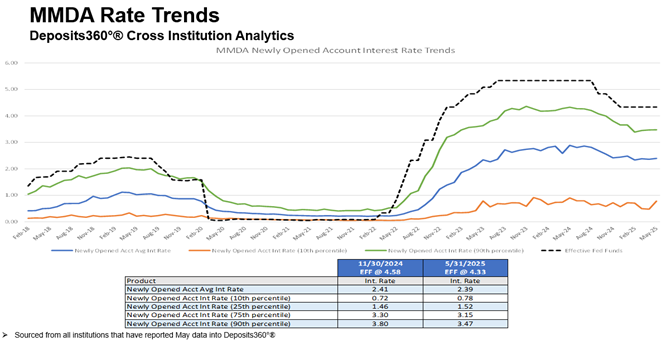
If historical spreads between Fed Funds and MMDA rates materialize going forward, it is possible that MMDA rates will remain flat-to-slightly higher even if the Fed were to cut another 25 to 50 basis points later this year.
Important Deposit Outflow Trends
Assuming that recent balance and rate trends continue to play out over the short-term, with no major surprises on the economic front, some institutions will be challenged to meet budgeted deposit growth in 2025. Successful institutions will not only leverage data to strategize on growth opportunities, but will also monitor those depositors that may have elevated risk of balance outflow.
DCG identifies and tracks several account attributes that influence balance decay (rate of existing balance outflow) within Deposits360°. The following chart shows the Cross-Institution outflow rate associated with those accounts with a high rate (above the 80% percentile in DCG’s Cross-Institution database) and only hold one account in their deposit relationship with the institution.

The trend shows a materially higher net outflow rate for those high-rate/single-account depositors compared to others. DCG also monitors those accounts that have a balance greater than $250k and have been opened for less than a year.
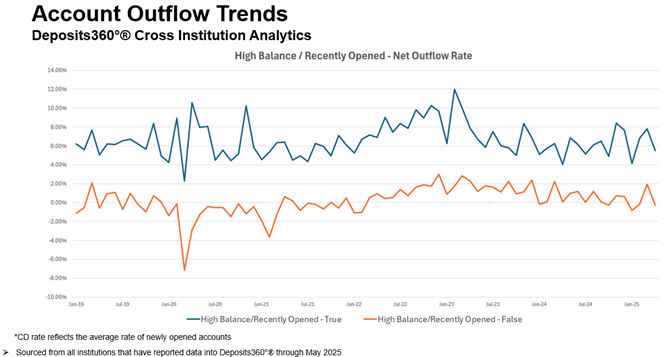
The chart shows an even bigger delta, with outflow rates up to five times higher for high-balance/recently-opened accounts compared to the sub-$250k/older-than-12-month accounts. These charts highlight the importance of regularly monitoring your deposit base and understanding the relative concentrations and risks associated with various account attributes.
Darling Consulting Group will continue to monitor the Cross-Institution data in Deposits360° and bring you insights to help you navigate the current economic environment.
To learn more about how DCG's Cross-Institution Analytics can help drive strategic decision-making, click here.
© 2025 Darling Consulting Group, Inc.


