




Deposit Retention: Will This Rate Cycle Be Different?

Deposit Retention Index® September 2026 Update

With a new interest rate cycle underway, banks and credit unions face a familiar question: How much will they have to pay to keep their deposits, and will higher rates be enough? In this quarter’s update on DCG's Deposit Retention Index® (DRI), we examine the latest retention trends and what may be different this time around.
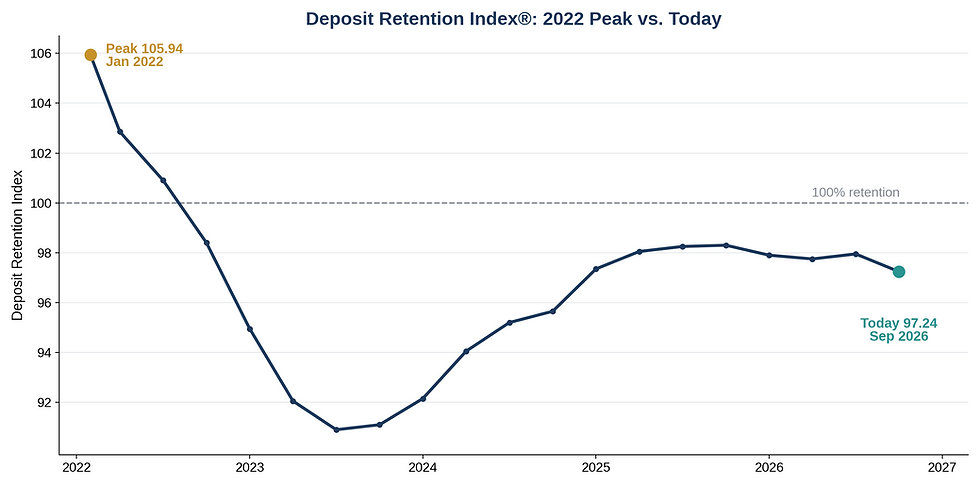
The DRI remained near 97% as of quarter end (readings above 100% indicate growth in retained deposit dollars, while readings below 100% signal contraction), and DCG does not anticipate significant future movements outside of major economic events. However, the Index has declined approximately 70 basis points since June, reflecting continued weakening in deposit retention.
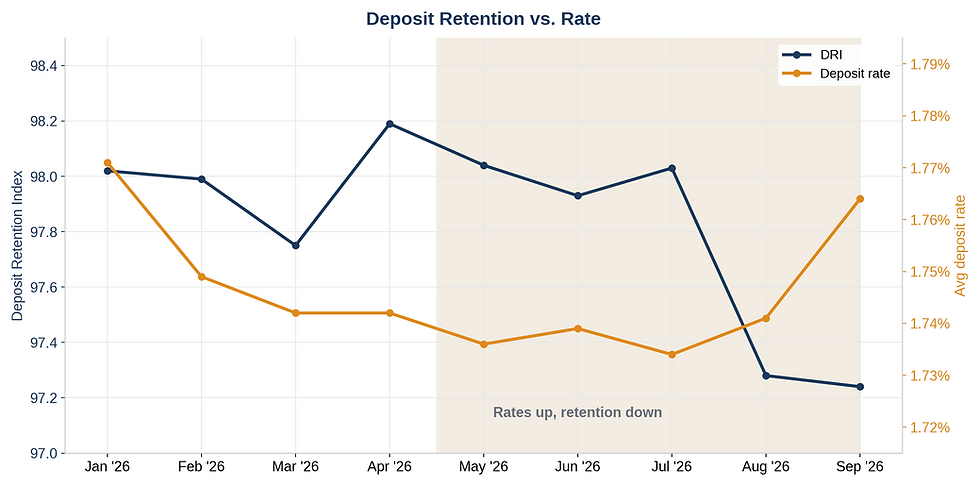
The Fed's September decision to raise rates by 25 basis points marked the beginning of a new tightening cycle. In the weeks following the decision, average deposit rates among DCG’s Deposits360°® clients (based on 9/30 data) increased 2 basis points to 1.76% compared to August month end. Given that the DRI measures retention against a full year earlier, the impact of this latest Fed rate hike has yet to meaningfully influence the Index.
The question now is whether higher deposit rates will actually improve relationship retention, or whether institutions will simply end up paying more for the deposits they already have.
A New Tightening Cycle: Will This Time Be Different?
When the Fed began raising rates in 2022, banks and credit unions were coming off a period of extraordinary deposit growth. Flush with liquidity, many institutions were initially slow to pass along higher rates to depositors. As the gap between deposit rates and alternative investments widened, customers increasingly moved money in search of better returns.
The industry finds itself in a much different position today.
Source: Darling Consulting Group, Deposit Retention Index®
The Case for More of the Same
Treasury yields have moved higher, with risk-free returns now competitive with, and in some cases exceeding, similarly termed CDs. If customers can earn a comparable or better return elsewhere, what's stopping them from moving again?
Customers have also been through this before. They're arguably more informed, more comfortable comparing rates, and more willing to move money than they were heading into the last cycle. And as the chart below illustrates, the recent uptick in deposit rates has yet to translate into an improvement in retention.
Source: Darling Consulting Group, Deposit Retention Index®
Then there's competition. It's no longer just traditional banks and credit unions competing for deposits. Fintech platforms, tokenized deposits, and other emerging alternatives are creating new ways to move and hold money, giving customers more options and institutions more competition for those relationships.
Lastly, there's the earnings side of the equation. During the previous tightening cycle, institutions benefited as lower-yielding COVID-era loans gradually paid down or repriced at higher rates, helping offset rising funding costs. With much of that repricing already behind them, institutions may have less earnings flexibility to absorb another round of deposit competition.
This puts institutions in a difficult spot. Raising rates may help defend balances but puts pressure on margins, while holding the line risks losing deposits to competitors willing to pay more. If these pressures persist, the DRI could potentially deteriorate further, with institutions having less room to absorb the cost of competing.
The Case for Improved Retention
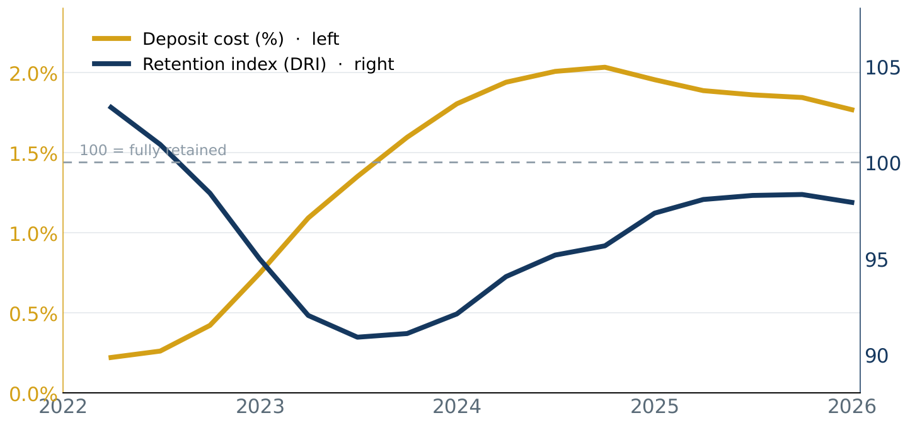
Of course, there are reasons to think deposit retention could improve. In 2022, most institutions entered the tightening cycle paying next to nothing on deposits. As shown below, average deposit costs were hovering around 30 basis points, while the DRI stood above 100%, indicating deposit growth in retained relationships. Fast forward to today, and the picture looks much different. Premium-rate MMDAs and high-yield savings accounts are in the upper 3% range, while CD specials have started to creep north of 4%.
Source: Darling Consulting Group, Deposit Retention Index®
It's also worth considering how much of the industry's most rate-sensitive money has already moved. After several years of aggressive deposit competition, customers who have repositioned their balances may now be comfortable where they are. If they're already earning a competitive rate, is another 25 or 50 basis points enough to convince them to move again?
Then there's liquidity. Pandemic-era stimulus, elevated savings rates, and reduced spending created substantial excess liquidity heading into the previous tightening cycle. Much of that liquidity has since been spent, invested, or repositioned, potentially leaving fewer dollars available to migrate.
Institutions have also become more deliberate about deposit pricing and identifying at-risk relationships. Whether that translates into improved retention or simply a higher cost of keeping those deposits remains to be seen.
All of this suggests the industry's deposit base may be more resilient than it was heading into 2022. If that's the case, the pace of deposit contraction may slow in the DRI over the coming months.
What Comes Next for Deposit Retention
It's still too early to know how this tightening cycle may affect deposit retention, but the industry is starting from a much different position than it did in 2022.
Beyond traditional rate competition, emerging alternatives could introduce additional pressure on deposit retention over time. While the DRI cannot identify where departing balances are going or what prompted those movements, it can help institutions monitor broader changes in depositor behavior as the competitive landscape evolves.
Ultimately, the key signal in the coming months will be how the DRI moves relative to deposit costs. If institutions continue paying more for deposits without a corresponding improvement in retention, that could be a much bigger concern than the decline in the index itself.
About DCG’s Deposit Retention Index®
Darling Consulting Group created the Deposit Retention Index (DRI) as a leading indicator of national liquidity conditions and competitive pressure. The DRI measures the percentage of deposit relationships and associated dollars that banks and credit unions retain compared with the same point one year earlier. Built from account-level data across consumer, business, and municipal accounts, the DRI provides a national benchmark for understanding deposit retention over time. Readings above 100% indicate growth in retained deposit dollars, while readings below 100% signal contraction.
© 2026 Darling Consulting Group, Inc.


